I’ve been neck deep in the technology of solving for fraud since the mid-1990’s and have seen my share of pioneering breakthroughs during that time.
Late in 2002, I was fortunate to have worked with Stephen Coggeshal to build the industry’s first predictive identity fraud model ever. Prior to this first model, fraud detection technology consisted of simple data matching and validation of name, DOB, SSN and physical address.
That same year, I was alongside Xiou Shao when he was the first to apply graph theory to a consortium of new credit applications to create a pioneering real-time use of link analysis to drive predictive fraud signals. I also worked with Steve Dyrdahl who implemented a creative tech stack that would allow graph theory to be used in real-time against incoming applications. A few years later, in 2003 I worked with Glenn Hoffman when he first used machine learning to increase the predictive lift of identity models against industry data over-and-above logistic regression. And, in 2004 I identified a new type of fraud behavior and coined the phrase “synthetic” fraud, and started using link analysis to identify that behavioral pattern in real-time.
Since then, I lucked out and had the opportunity to work with Naftali Harris and Max Blumenthal at SentiLink who super-fueled synthetic financial fraud identification technology to the industry-leading standard that it is today.
Over the course of the 2010’s, I patented revolutionary data sharing technologies with Brian Ketelsen that leap-frogged entrenched 50+ year old business models that unfortunately still stand today, as well as created patented technology to share likely fraud attacks to consumers through companies like LifeLock. Most recently, I’ve worked with people like Yigit Yillidrim who was one of the first to use generative AI to solve for identity related fraud.
In all of those years, I’ve performed thousands of fraud investigations, have stood up two fraud Investigation platforms, and was lucky enough to resource them with some of the industry’s most creative fraud Investigation professionals.
However, regardless of how hard I searched, I have not found a great fraud technology to represent link analysis in a way that could prove useful to a fraud or AML investigator for deep, meaningful, and efficient real-time investigations of fraud rings and other fraudulent activities.
Until now.
Introducing DataVisor’s Knowledge Graph
Knowledge Graph is a proprietary identity and transaction graphing technology natively-built within the DataVisor end-to-end risk management platform. This pioneering technology provides a real-time dynamic graph, or picture, of an identity or account and the associated transaction and payment flows.
DataVisor’s Knowledge Graph is uniquely positioned to operationalize the real-time information needed for fraud and AML Investigators to investigate various types of fraud — identity theft, money laundering, synthetic identities, credit card fraud, and more — and efficiently make and report on decisions that will impact real-time production. It is mind-blowing in its scope and scalability, range of use cases, and simplicity of use.
Here’s what all this means.
Really Real-time. Really.
First and foremost, most graph analysis packages on the market do not feature real-time graph analytics. They do an ok job linking large datasets in a batch process using stagnant data, can produce simple graphs that reflect out-of-date knowledge, and do not run in conjunction with a real-time production system. This is because they are generally batch graph linking systems, which is unfortunate, especially as we move into the world of real-time payments.
Knowledge Graph is different and was built natively to work within the DataVisor platform to quickly gather up-to-the-second identity and transactional data, and develop a sophisticated and usable graph database in real-time. Investigators using Knowledge Graph do not need to re-engage with a real-time system after identifying suspicious patterns or linkages found within a non-native graphic system to ensure there have been no changes to the stored identity data, or any new transactions or updated account labels.
In response to graph queries, Knowledge Graph uses real-time data and displays the linkages between data points with all of the corresponding data from various data sources, providing everything needed to complete a fraud or AML investigation in a single motion. This helps to accelerate and optimize decision-making.
Like a Bunny, Knowledge Graph Was Built to Hop!
Many graphing technologies can perform the first hop with a fairly quick response time (again though generally against batch data). What does that mean? “One hop” is the equivalent of me making a payment to you and several other people. Regardless of how many people I make a payment to, it is still considered “one hop.”
For even more insight, graph technology can produce a second hop (and some even more than a second hop). That second hop would, for instance, show that I paid you and then you paid someone else.
While some graph-based technologies can perform this second hop, it is rare to find a native graph-based fraud detection system that can perform both hops in real-time against real-time data to help identify fraud patterns. But, that is exactly what Knowledge Graph performs for fraud and AML investigators using the DataVisor platform.
Why is this important? The second hop can be invaluable in efficiently identifying fraudulent money movement and supporting fraud findings by understanding where, who and how money moves across financial services, financial institutions, and the entire financial ecosystem. This hard-to-come-by second hop understanding helps our customers reduce the time it takes to investigate an entity and all its relationships, reducing operational costs and creating more accurate fraud labeling, and SARs and CARs reporting.
Easy Customization of Graph Parent and Children Nodes
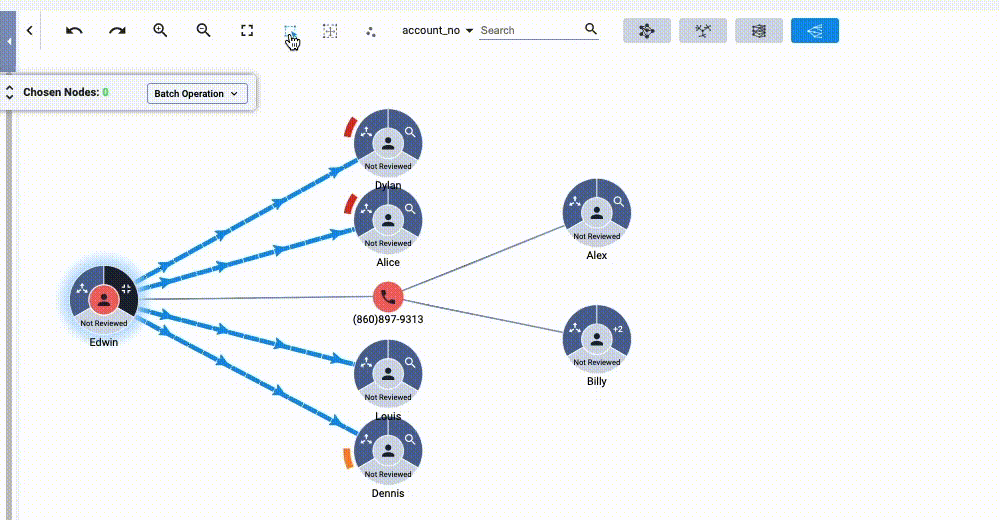
A graph node, usually represented by a circle, is one of the fundamental units that make up a graph. In a graph diagram, a node is usually represented by a circle. Each circle, or node, generally contains a label and each label can have several subnodes.
Subnodes, also called child nodes, make up a part of the larger parent node and help to tell the graph what edges should be drawn and the connections that the edges should seek. Sophisticated graphs will contain both a parent node and potentially several child nodes.
For fraud and AML efforts, the likely parent node will be the consumer “name” or the “account number” and the child nodes can be made up of “physical, email or IP address, phone numbers and account numbers, SSN/ITIN or data of birth (DOB). As you can see, a node by itself can contain a great deal of information or just a single element. Oftentimes, these nodes can be fixed or difficult to customize.
DataVisor’s Knowledge Graph allows a user to easily add and change labels of the parent node, as well as add and change its subnode children in real-time with a simple click . This enables fraud and AML investigators to customize their efforts on the fly, and introduce subtle changes to their investigative process as they attempt to identify fraudsters.
Graph Edges with a Packed Real-Time Edge
Graph edges represent relationships between nodes. They are the connections that link nodes together, defining how entities interact with one another. Each edge can have a direction and a type, which helps in understanding the nature of the relationship between the connected nodes.
In a standard graph, edges only connect vertices without any additional data. A directed graph, or digraph, is when the edges in a graph have arrows indicating direction. When an edge has an associated value or piece of information attached to it, that edge is considered "weighted."
What we mostly see in marketing materials representing graph technology is a standard graph that is not directed or weighted. Unfortunately, while these graphs can aggregate and display what appears to be a great deal of information about financial patterns and linkages between nodes, they are not operational and can not provide more than a pretty picture that gives the fraud and AML investigator a “feeling” of the risk of an identity or account.
The edges of Knowledge Graph are directed and show which way money is flowing across nodes. Additionally, each edge is weighted and holds a real-time link to every transaction that has flowed between those two nodes. Fraud and AML investigators don’t have to flip between screens to find transactions to find a deeper meaning in the relationships between two nodes. All of the data they need is available with one click, saving time and costs. Additionally, the terribly frustrating work of bouncing back and forth between screens is eliminated.
Everything Everywhere All At Once and All Real-Time
Knowledge Graph was built natively within the DataVisor platform to access real-time data, display the necessary graph data for efficient fraud and AML investigations, mark the final disposition on an account (or accounts), automatically label fraud and update a black list if desired, all with a few clicks. Simply put, there is no other graphing system in our industry today that offers this extremely dynamic and efficient capability.
What this means is that the work of a fraud or AML investigator will be fed back into the system immediately. This is then followed by an immediate update to the production system with findings from the investigation, which can be used immediately in production fraud scoring and machine learning models and algorithms, or for AI model creation.
No more sending back-and-forth non-secure excel spreadsheets or waiting for systems to batch update one another — DataVisor’s Knowledge Graph overcomes all of that and gives fraud and AML investigators the real-time data about potentially fraudulent transactions. Its simple-to-understand UI and update mechanism helps to super-fuel their efforts. And speaking for all investigators — it’s about time to get some cool technology!
The Search is Over
These are just a few of the reasons I believe my long search for the holy grail in advanced graph technology is over.
Knowledge Graph sets the standard for what graph algorithms should look like in our industry. It’s natively built, for starters. It offers real-time graphs and data, customizable nodes, and weighted edges, and it’s fully integrated with your decisioning profile and transactional data.
Simply put, Knowledge Graph doesn’t only generate pretty pictures. It operationalizes the knowledge learned in an identity graph to speed accurate investigations and decisions that are captured in real-time and propagated across your entire portfolio. This enables real-time scoring and the development of accurate signals, rules and models.