The theft of more than $6 billion from Binance is a striking example of how a cyberattack can become a complex financial crime operation. The initial compromise gave attackers access to the exchange’s wallet infrastructure. Within minutes, assets began leaving Binance wallets across multiple blockchains. What followed was a large-scale effort to distribute, convert, and obscure the stolen funds.
For financial institutions and crypto businesses, the implications extend beyond the breach itself. Stolen assets may eventually reach exchanges, payment providers, and other services through accounts that appear unrelated when viewed individually. Identifying the connections among those accounts—and the patterns in how funds move through them—can create opportunities to interrupt the cash-out.
DataVisor’s Unsupervised Machine Learning (UML) and Knowledge Graph are designed to uncover these relationships. By bringing together onboarding, identity, device, and transaction signals, they help institutions identify coordinated activity at critical points, including account creation and money movement.
This article examines how the Binance attack unfolded, how the stolen assets were moved, and how a connected detection strategy can help institutions identify and disrupt suspicious activity at potential cash-out points.
How the Binance Attack Unfolded
On October 29, 2026, attackers transferred billions of dollars in digital assets from Binance-controlled hot wallets across multiple blockchains. Binance estimated approximately $6.34 billion in affected assets. The FBI attributed the theft to North Korea’s TraderTraitor activity.
The theft was the culmination of a campaign that began months earlier. According to Binance’s initial findings, described by CNBC and StepSecurity, the attackers used a tampered developer tool and a fake recruitment process to compromise engineers’ computers. They then used an internal AI tool to reach other engineers’ machines and obtained credentials that helped them access Binance’s wallet-signing service.
Image: Timeline of the Binance attack from the tampered developer tool to post-theft laundering
Sources: Binance’s initial findings, StepSecurity, and Elliptic.
The attackers used that access to initiate unauthorized transfers outside Binance’s normal withdrawal process. TRM Labs traced approximately $6.36 billion in transfers from Binance wallets across 10 blockchains, with most of the value leaving in about 20 minutes. Its estimate includes approximately 18,270 BTC, 233 million XRP, and assets on Ethereum, Tron, Solana, and other networks. Different investigators’ totals and chain counts vary with their tracing and valuation methods.
On Ethereum, the attackers also used a valid authorization to delegate a Binance hot wallet’s execution to an attacker-controlled contract. The contract swept assets out of the wallet and remained able to move additional funds until the authorization was cleared. As StepSecurity explains, suspending Binance’s withdrawal service did not itself revoke that on-chain permission.
The initial compromise and the subsequent laundering are distinct phases. The theft involved unauthorized transfers from Binance-controlled wallets. The later dispersal involved stolen assets moving among blockchain addresses and services. A blockchain address is not the same as a customer account at an exchange, and the scale of on-chain dispersal does not establish how many exchange accounts the attackers used.
How Funds from the Binance Hack Were Laundered
The attackers faced an immediate constraint: a substantial portion of the stolen assets was held in stablecoins whose issuers could freeze them. The early response became a race between the attackers seeking to convert those assets and the issuers and investigators working to restrict their movement.
Elliptic reported that approximately $786 million in stablecoins was converted before freezes took effect. On Ethereum, the attackers swapped 434 million USDT for ETH and used additional USDT as collateral to borrow ETH. On Tron, they swapped 234 million USDT for TRX before Tether froze the remaining funds. Elliptic’s November 9 analysis estimated that approximately $2.85 billion had been frozen or seized.
A freeze restricts the movement of affected assets; it is not the same as their return. Binance also said it would cover the financial impact with company resources—a separate action from recovering stolen assets, as StepSecurity noted.
From Large Transfers to Thousands of Smaller Movements
After the initial transfers, the laundering effort became increasingly distributed. In its analysis updated November 9, Elliptic traced more than 20,000 wallets, 16 blockchains, and at least 65,000 transactions associated with the activity.
The movement combined several techniques:
- Splitting assets across addresses. Funds moved from larger holdings into many smaller addresses, multiplying the transactions investigators needed to follow.
- Swapping assets. The attackers exchanged stolen tokens for other cryptocurrencies, changing the asset that investigators needed to trace.
- Moving between blockchains. Cross-chain bridges and swap services transferred value from one network to another, separating deposits and payouts across different chains.
- Passing funds through protocols. Lending vaults, liquidity pools, and other services introduced additional steps between the original funds and later recipients.
- Mixing. Some funds entered services that pool assets from multiple users, making the connection between deposits and withdrawals more difficult to trace.
These methods were not used in a single, uniform sequence. The attackers combined and repeated them as different portions of the proceeds moved through the ecosystem.
The laundering stages shown are simplified; their order can vary. Sources: Elliptic and Chainalysis.
One Route: From Tron to Ethereum
The Tron activity illustrates the complexity of the operation. On October 30, Elliptic traced a distribution wallet sending TRX in smaller amounts to hundreds of new addresses. The funds subsequently spread across approximately 7,700 addresses, with portions moving through cross-chain bridges and largely being paid out as ETH on Ethereum. Elliptic matched at least $147 million bridged out of Tron in its November 9 analysis.
Other portions followed different routes. Some SOL was sold for USDC, bridged to Ethereum, exchanged into ETH, and then converted into bitcoin. One batch crossed four blockchains in less than five hours. By November 9, Elliptic had also observed theft-linked funds passing through bitcoin mixing transactions and Tornado Cash. Elliptic’s timeline details these movements and the limits of what can be inferred from them.
Moving Cryptocurrency Is Not the Same as Cashing Out
Swapping one cryptocurrency for another or moving value between blockchains does not necessarily convert it into conventional currency. As of Elliptic’s November 9 update, approximately $3.0 billion remained in theft-linked addresses, largely in BTC and ETH, and a negligible amount had likely been cashed out.
That distinction is important for assessing both the incident and the opportunity for intervention. Much of the observed activity was still on-chain conversion and movement. If funds later reach an exchange, broker, payment provider, or other service, that service may have an opportunity to identify the activity using the data and controls available to it.
Why the Cash-Out Presents a Different Detection Challenge
Blockchain investigators follow the movement of assets through public addresses and services. An exchange or financial institution has a different—and complementary—view: the customer accounts, identity information, devices, logins, deposits, trades, and withdrawals occurring within its own environment.
The point at which those views meet can be particularly valuable. A blockchain intelligence provider may identify an address or transaction as exposed to stolen funds. The receiving institution can then evaluate that information alongside its broader view of account activity and relationships, adding context to the transaction under review.
The challenge is not limited to a single large transfer. An operator may distribute activity across multiple accounts and transactions. A monitoring strategy focused exclusively on one account or one threshold may see a series of ordinary-looking events without recognizing the coordinated activity they form.
This is where account-level and network-level intelligence become important. The goal is not to replace blockchain tracing or wallet security. It is to add a connected view of the activity an institution can observe—and use it to support decisions before a deposit, conversion, withdrawal, or payout is completed, as appropriate to the institution’s workflow.
Two Opportunities to Identify and Disrupt Suspicious Activity
DataVisor’s approach brings detection across the account lifecycle. For an operation seeking to move illicit proceeds through a financial service, two stages are particularly important: account creation and money movement.
1. Account Creation: Identify Networks Before They Transact
Onboarding is more than an identity verification event. It is also the first opportunity to understand how a new account relates to other activity on the platform.
A single application may appear legitimate when assessed on its own. Viewed alongside activity across the platform, however, it may form part of a broader pattern that warrants attention.
DataVisor brings together available account, identity, device, and behavioral intelligence to assess relationships across the population. The objective is to understand activity in context: a connection alone does not establish fraud, but the broader pattern can help teams determine whether further review is appropriate.
DataVisor UML is designed to surface unusual and coordinated patterns across the population without requiring historical fraud labels. Knowledge Graph enables investigators to examine the relationships among the accounts and the underlying signals. Depending on the institution’s policies, the resulting intelligence can support additional verification, a review, or an onboarding decision.
The benefit of this early view is time. Identifying a suspicious network at onboarding can give an institution the opportunity to investigate before those accounts are used to receive or move significant funds. Detection can continue after onboarding as new transactions and relationships emerge.
2. Money Movement: Connect the Activity Across Accounts
At the transaction stage, an institution can assess money movement in the context of the account and the wider network. This matters when activity is distributed across multiple accounts: individual events may appear unremarkable even as their combined pattern suggests coordination.
DataVisor brings transaction intelligence together with available account and network context. Where an institution incorporates blockchain intelligence, that information can add another perspective on potential exposure to stolen assets. Evaluating these perspectives together helps risk teams identify activity that merits review without relying on an isolated indicator.
An Illustrative Detection Scenario
Consider a financial service encountering a series of transactions across accounts that appear unrelated when reviewed individually. A connected view may reveal that the activity forms a broader pattern, enabling the institution to assess the network as a whole rather than relying on the apparent risk of each event in isolation.
Image: Illustration of individual activity connected into a network for risk review
Illustrative view of connected activity and risk review.
With the relevant signals available, UML can help surface the coordinated pattern and Knowledge Graph can show how the accounts are connected. A configured decision flow could then route the activity for review or apply another action under the institution’s policies.
The example illustrates why a connected view matters: the information needed to recognize coordinated risk can be distributed across multiple accounts and events, rather than contained in any single transaction.
How DataVisor UML Detects Coordinated Activity
Supervised machine learning uses historical examples to identify patterns associated with known outcomes. Rules encode conditions that risk teams already know they want to monitor. Both are valuable, but emerging schemes may not resemble a known case or meet a predefined condition.
DataVisor’s Unsupervised Machine Learning addresses that gap by analyzing the population itself. It is designed to identify anomalous behavior and coordinated patterns without waiting for a body of confirmed fraud labels.
Establish Context Across the Population
UML can evaluate identity, device, behavioral, transaction, and relationship features together. It considers how activity compares with relevant peer groups and behavioral baselines, as well as whether multiple accounts exhibit similar patterns.
Activity that is ordinary in one context may be unusual in another. Comparing behavior across relevant populations helps provide context that a single rule or event cannot.
Surface Clusters, Not Just Individual Outliers
A coordinated operation may not produce the largest or most unusual individual transaction. Its distinguishing characteristic may be that multiple accounts follow a similar sequence or share related attributes.
UML can help surface those clusters by evaluating activity and relationships across multiple dimensions. As new events arrive, they can add context to the emerging pattern.
Turn Detection into Action
An anomaly is a starting point for a risk decision, not a verdict. DataVisor can combine UML output with rules, graph intelligence, device signals, and other available data to support real-time decisions and investigations. The institution determines the appropriate action, including when to seek additional verification, hold a transaction, or route a case to an analyst.
This layered approach also helps teams address a practical tension: increasing detection coverage without treating every unusual but legitimate customer as a confirmed threat. Context across multiple signals can help prioritize the activity that warrants attention.
How Knowledge Graph Reveals the Network Behind the Alert
A suspicious account is often the beginning of an investigation, not the complete picture. Understanding whether it is connected to other accounts or payment destinations can change the scope of the response.
DataVisor Knowledge Graph connects accounts, transactions, and other relevant entities to reveal relationships across the network. As configured data arrives, the graph can update those relationships and support multi-hop analysis.
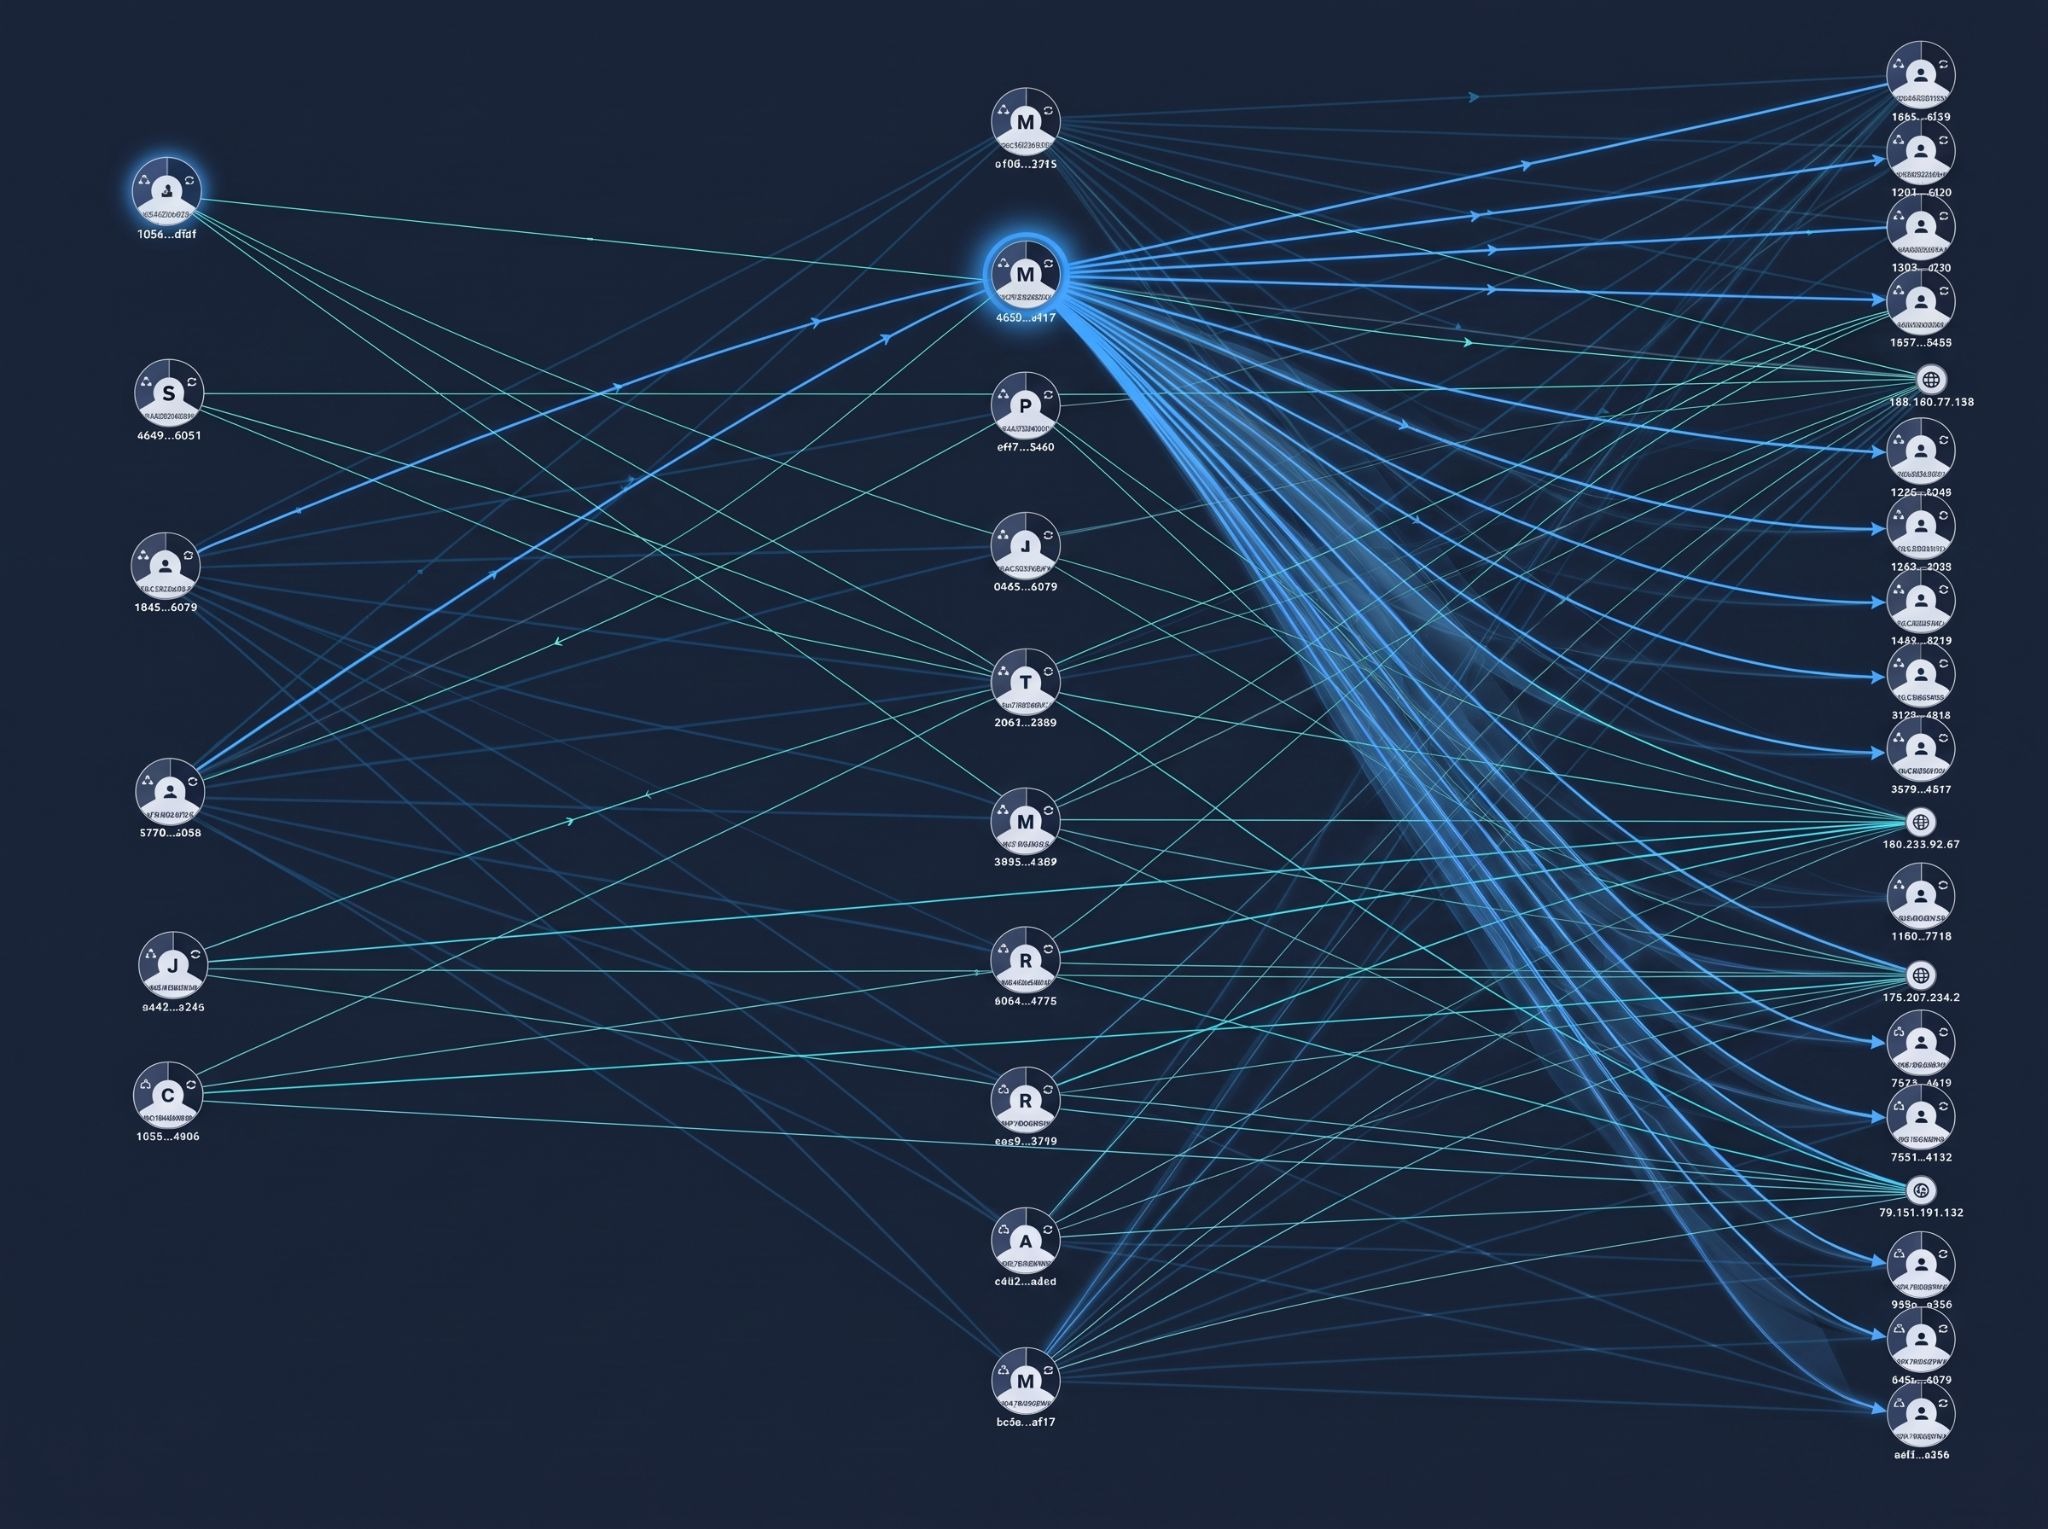
The graph helps an analyst move from a single alert to the surrounding network, exploring relationships across multiple levels rather than reviewing each account in isolation. It also provides context for distinguishing a potentially meaningful pattern from an incidental association, supporting a more complete investigation.
Graph intelligence is not limited to visualization. Where configured, graph-derived relationships can also become features or signals in detection and decisioning. UML can surface suspicious patterns across the population; Knowledge Graph can expose the relationships behind them; and the institution’s decision and case workflows determine how to act.
From a Suspicious Deposit to an Investigation: How the Layers Work Together
A coordinated detection strategy depends on more than a model or a graph in isolation. It depends on connecting the evidence to a decision at the moment the institution can intervene.
Step 1: Bring the Relevant Signals Together
The institution brings available account, behavioral, and transaction intelligence into the detection workflow. Where applicable, it can also incorporate third-party blockchain intelligence to provide additional context on potential exposure.
The distinction between these sources matters. DataVisor’s analysis depends on the data supplied and integrated by the institution. Blockchain intelligence and the institution’s own account data provide complementary views, neither of which alone captures the entire ecosystem.
Step 2: Evaluate the Account and the Network
Rules can identify known risks, UML can surface unusual patterns across accounts and events, and Knowledge Graph can reveal relationships across the network. Together, these layers provide context that may not be visible in a single alert.
Step 3: Make a Decision at the Relevant Event
At a decision point—such as a deposit review, conversion, withdrawal, or payout—the institution can apply its configured policies. The appropriate response depends on the event, the strength of the evidence, and the institution’s authority over the transaction. Options may include additional verification, analyst review, a hold, or a decline.
Timing is essential. A decisioning system can only prevent an action if the risk information is available before that action becomes final and the service is integrated to enforce the decision. Monitoring after settlement remains valuable for investigation and future controls, but it is a different intervention point.
Step 4: Investigate the Connected Activity
When a case is escalated, investigators can examine the account history, the triggering transactions, related entities, and the connections that contributed to the alert. This enables a broader investigation into whether the activity reflects a coordinated operation or a legitimate relationship.
As new evidence is confirmed, teams can use the findings to inform subsequent monitoring and risk strategies. The result is a workflow that connects detection, explanation, and action rather than treating each alert as a separate investigation.
What This Approach Looks Like in Practice
A DataVisor case study illustrates the value of analyzing account creation and transactions together. A financial management platform was experiencing coordinated fraud involving onboarding, payments, and account takeover. Individual merchants and transactions did not consistently present obvious red flags, while the operation used rapid onboarding and fund movement calibrated to pass automated thresholds.
UML surfaced coordinated patterns across onboarding and transaction activity. Knowledge Graph, integrated into case management, helped investigators examine related accounts as a network and move from isolated alerts to a broader view of the operation.
The platform reported detecting more than 70% of coordinated fraud rings with UML and preventing $1.3 million in losses over three months. This was a separate deployment with its own use cases and data; its relevance to the Binance discussion is the detection principle: coordinated activity can become visible when accounts and events are analyzed together.
Building a Stronger Defense Against Coordinated Cash-Out
The Binance incident illustrates the scale of the challenge. Attackers did not need to rely on a single transfer after the theft. The proceeds could be divided, converted, and routed through a complex network of addresses and services. By November 9, investigators had documented tens of thousands of transactions while the ultimate cash-out path remained uncertain. Elliptic’s continuing analysis shows how quickly that picture can evolve.
For institutions that encounter suspicious assets or accounts, a stronger defense begins with three capabilities:
- Connect intelligence across the account lifecycle. Account, behavioral, and transaction data are more useful when they can be evaluated together.
- Look beyond individual thresholds. Rules for known risks should be complemented by analysis that identifies unusual clusters and coordinated behavior across accounts.
- Put network intelligence into the workflow. Investigators need to understand the relationships behind an alert, while decisioning systems need timely signals at the point where action is possible.
The original Binance theft was an intrusion into wallet infrastructure, and securing that infrastructure remains a distinct responsibility. The subsequent movement of stolen assets creates a complementary challenge for the exchanges and financial services that may encounter them. With the right data and integrations, DataVisor’s UML, Knowledge Graph, and decisioning capabilities can help those institutions identify coordinated activity and intervene before suspicious payouts or withdrawals are completed.
Strengthen Fraud and AML Detection with DataVisor
DataVisor combines unsupervised machine learning, Knowledge Graph, and real-time decisioning to help institutions detect emerging threats, investigate connected activity, and respond to financial crime. Learn more about DataVisor’s fraud and AML platform.